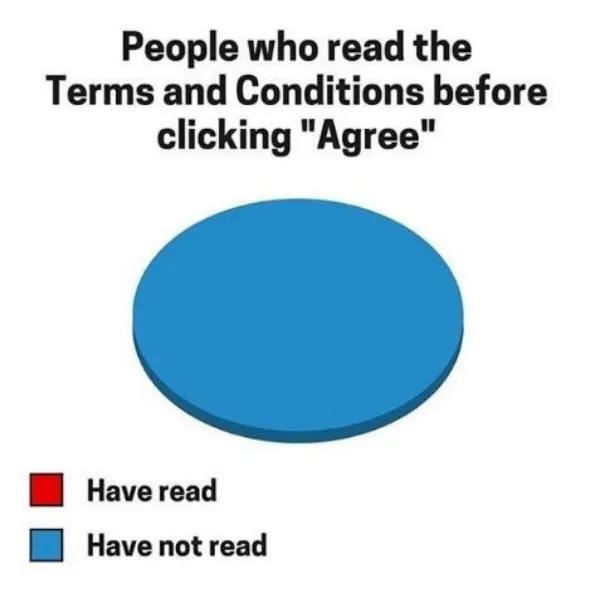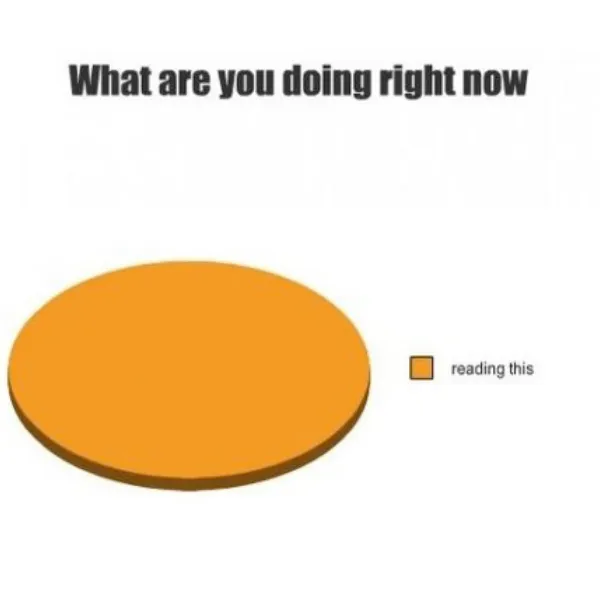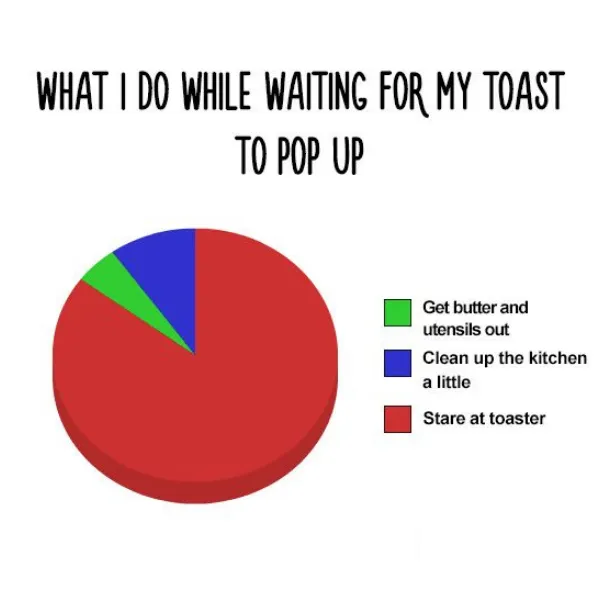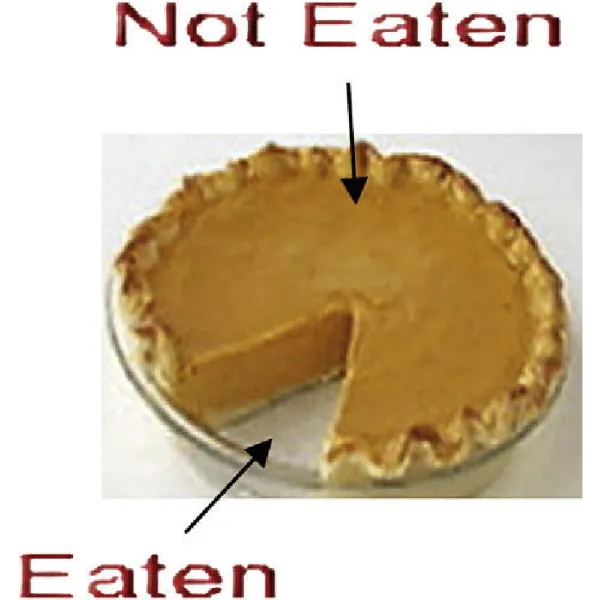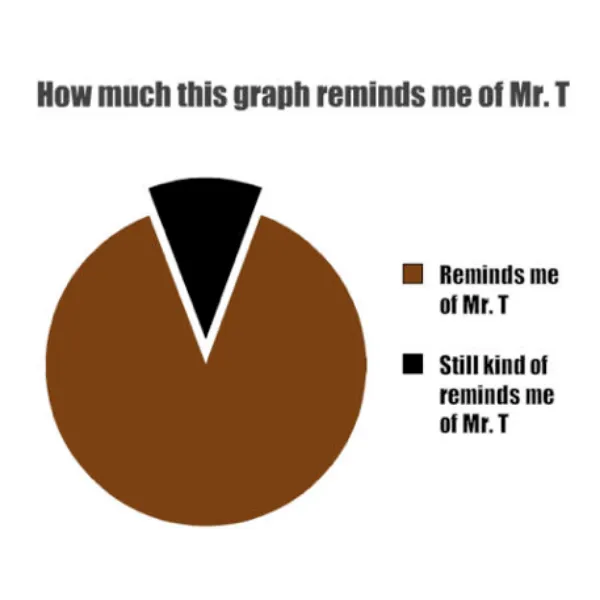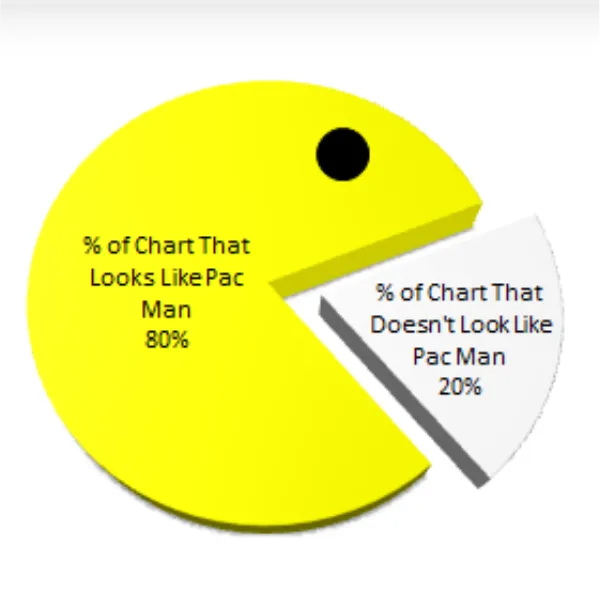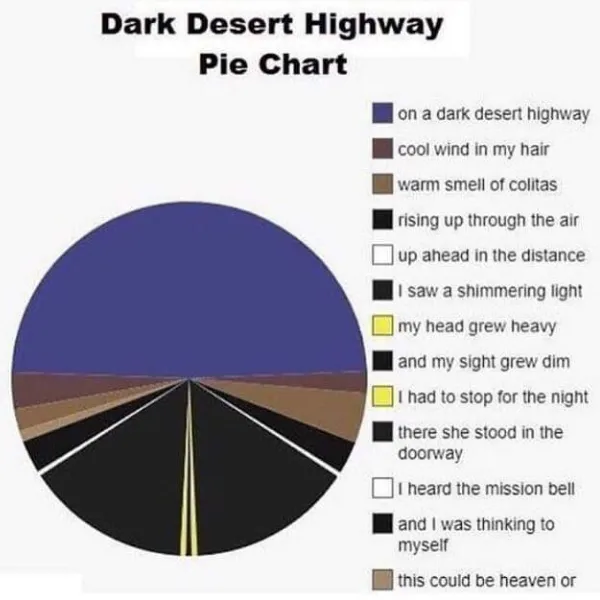
Charts are handy graphics that help us understand statistics and analytics better. With a whole wide variety of different types and formats, finding the right one to accurately portray your dataset is important! One of these formats is the pie chart: great for understanding scale and contrasting differences. But much like anything that exists, the internet has naturally taken them and used them for entertainment purposes. So to honor those who wasted their time making these pie charts, waste your time looking at these funny uses of quantitative data!
